Overview
Welcome to the Onyx Cloud Database Overview! This guide will help you navigate the overview screen to monitor your database's usage, health, and statistics effectively.
Introduction
The Overview screen provides a high-level summary of your database's performance, including usage metrics, health status, and recent activity. It helps you make informed decisions by highlighting key data points at a glance.
Accessing the Overview
To access the Overview, follow these simple steps:
Navigate to the Overview
Once signed in, click on the Overview link in the sidebar to access the overview screen.
Explore the Overview Layout
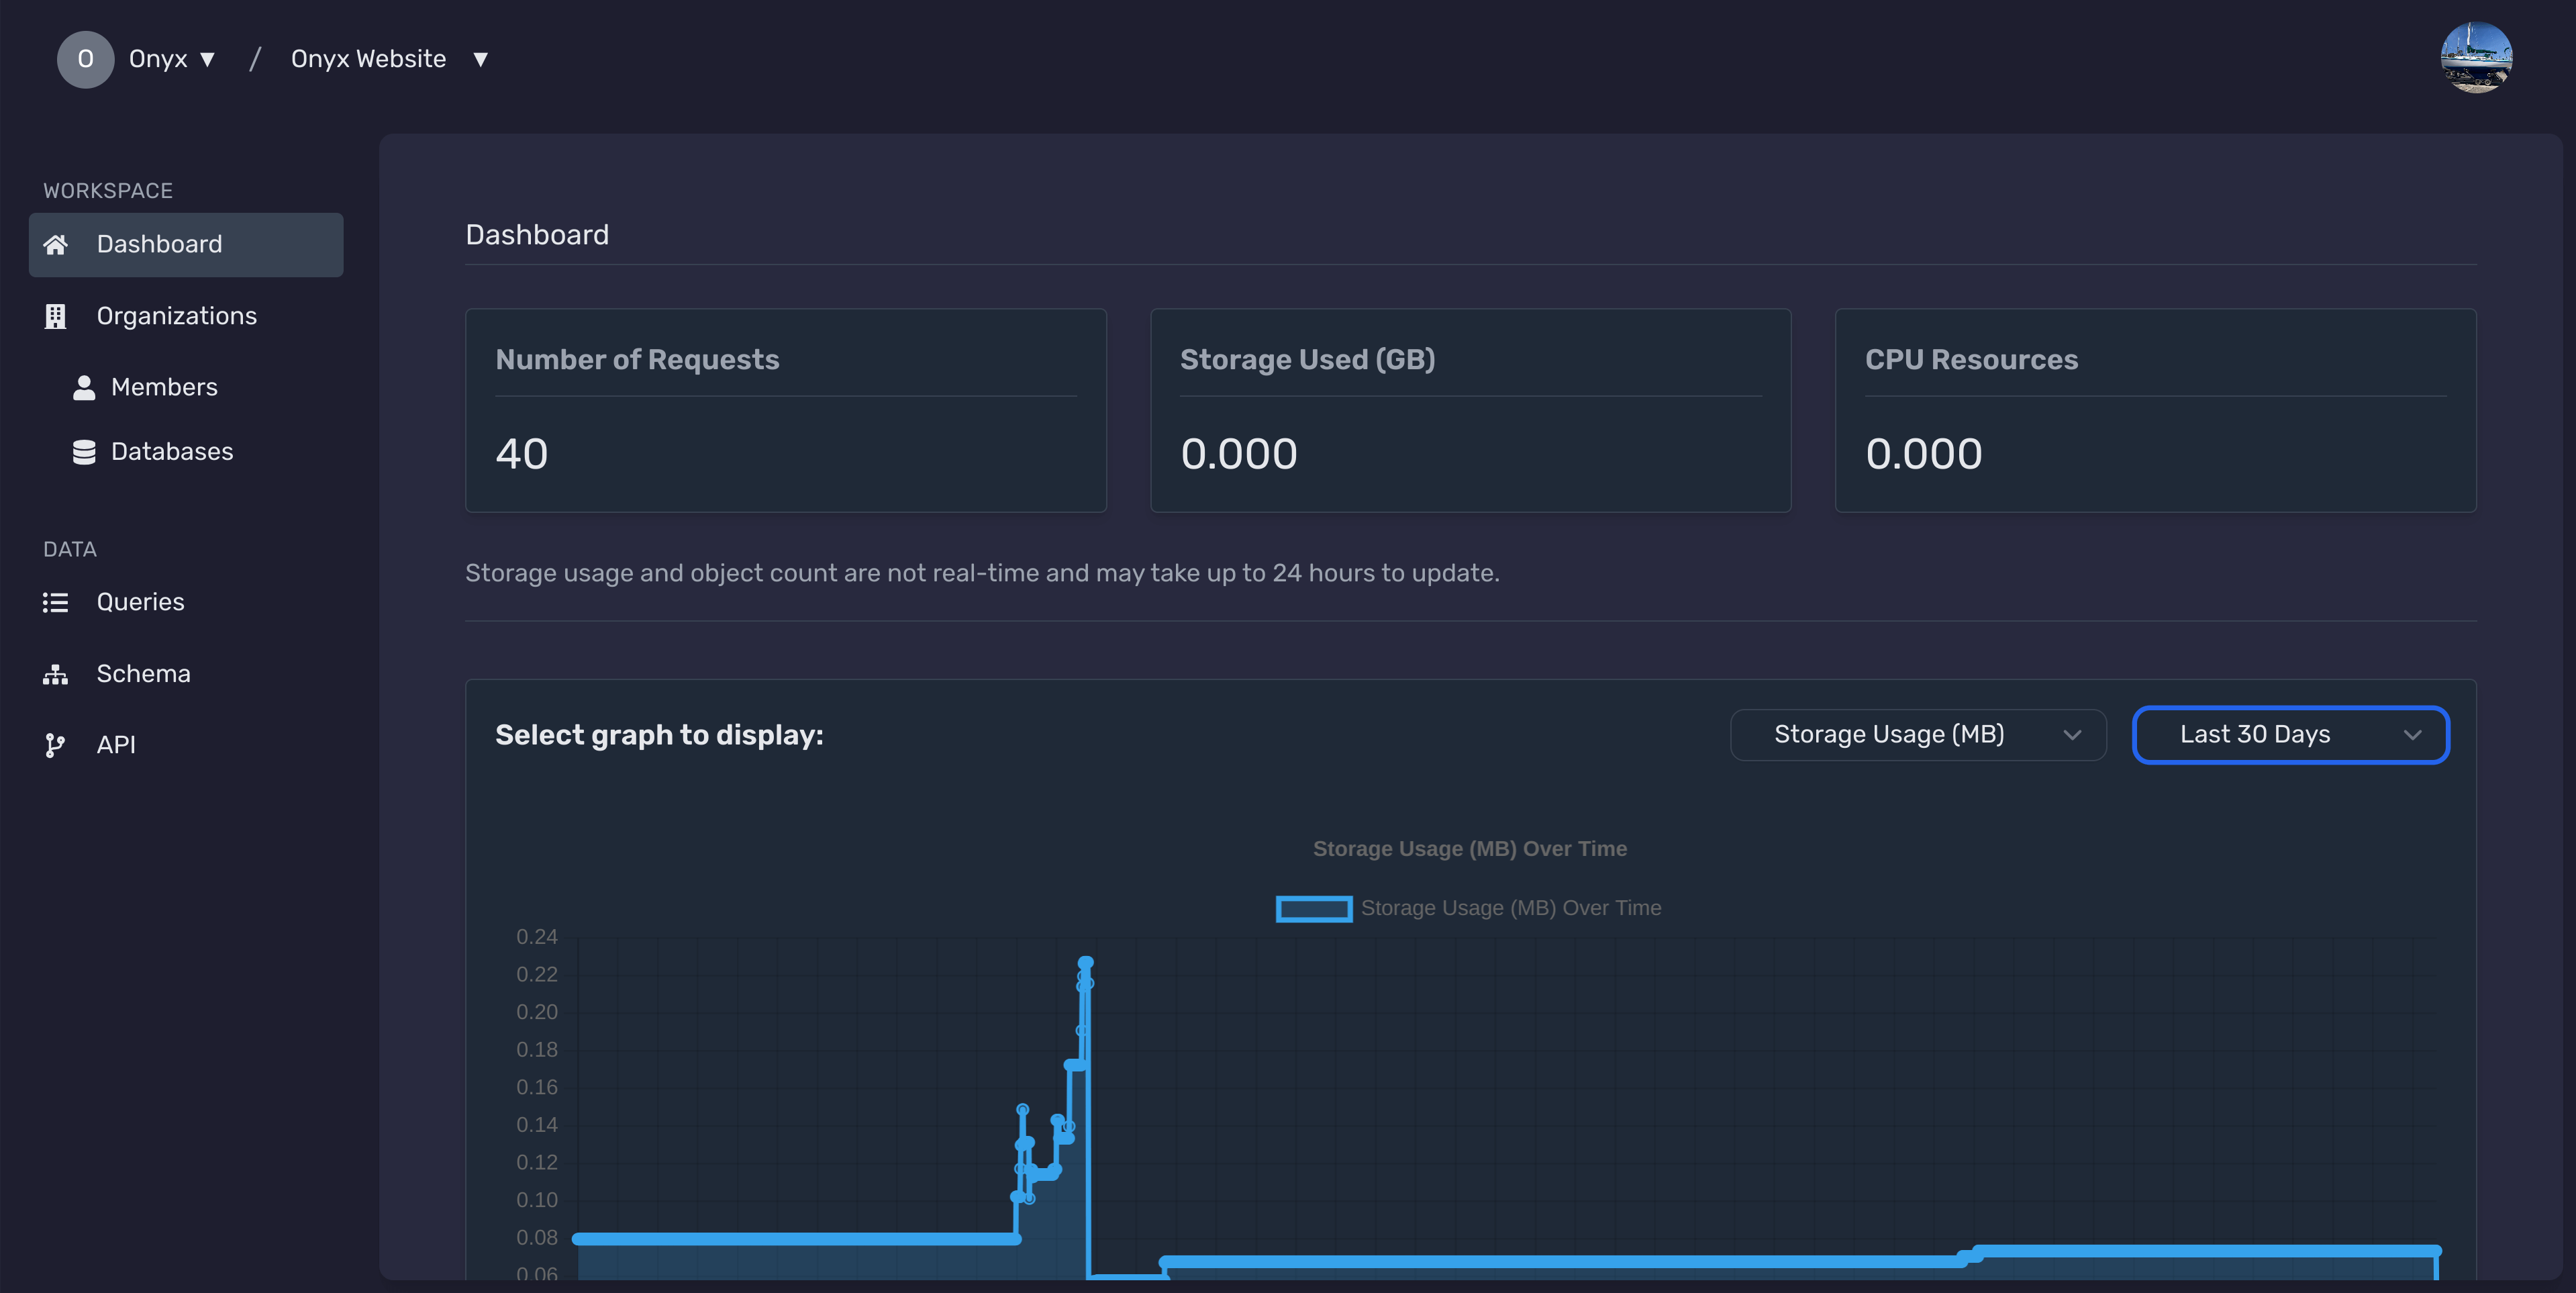
Familiarize yourself with the overview layout, which includes sections such as Usage Metrics, Health Status, and recent activity highlights.
Understanding Metrics
The Overview screen displays key metrics that provide insights into your database's performance and usage.
Number of Requests
This metric shows the total number of API requests made to your database within the selected time frame.
Storage Used (GB)
Displays the amount of storage space your database is utilizing, measured in gigabytes.
CPU Resources
Indicates the CPU resources consumed by your database operations, measured in milliseconds.
Interpreting Charts
Visual representations of your database metrics help you identify trends and patterns over time.
Select Metric to Display
Use the dropdown menus at the top of the charts section to select the metric and time range you wish to analyze.
Analyze Data Trends
The line charts display the selected metric's performance over the chosen time period, allowing you to spot increases, decreases, and anomalies.
Customize Chart View
Toggle between different chart types or adjust the time range to get a more detailed or broader view of your data.
Customizing Overview Views
Tailor your Overview to display the most relevant information for your needs.
Adjusting Display Settings
Access the settings panel by clicking the Settings icon on the Overview. Here, you can choose which metrics to display and customize their arrangement.
Saving Custom Views
After customizing your Overview, save your preferred view settings for quick access in the future.
Switching Between Views
Easily switch between different saved views to monitor various aspects of your database without reconfiguring settings each time.
Next Steps
Need Help?
If you have any questions or need assistance:
- Email:support@onyx.dev
- Documentation: Visit ourHelp Centerfor tutorials and FAQs.